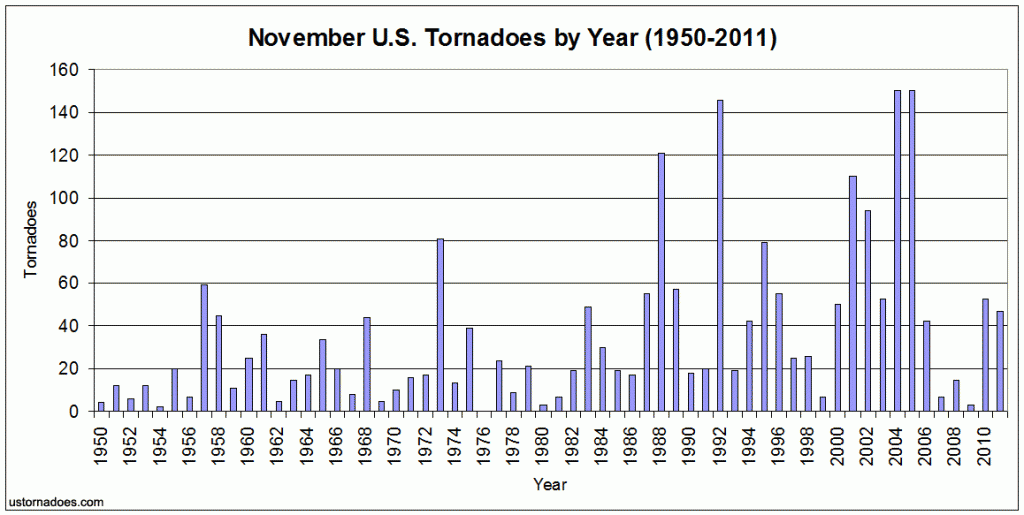
November features a slight bump in cumulative tornadoes compared to October, though the current averages for the month are less than those in October. The difference in overall numbers is largely influenced by a few outbreaks that set a few years well ahead of the typical November. As with October, part of a second peak sometimes occurs during this portion of the year.
Overall, the story is a fairly quiet one by this time when it comes to tornadoes, with significant parts of tornado territory largely shut down due to the intruding cold season.
November Tornado Climatology (1950-2011)
Total tornadoes: 2,205 (+63 from October)
Climatological average (1991-2010): 57.3 (-3.9 from October)
10-year average (2002-2011): 61.4
10-year median (2002-2011): 50
Long-term average (1950-2011): 35.6
Monthly high: 150 (2004, 2005)
Monthly low: 0 (1976) / 3 (2009), lowest recent
Total fatalities: 251
Total injuries: 5,060
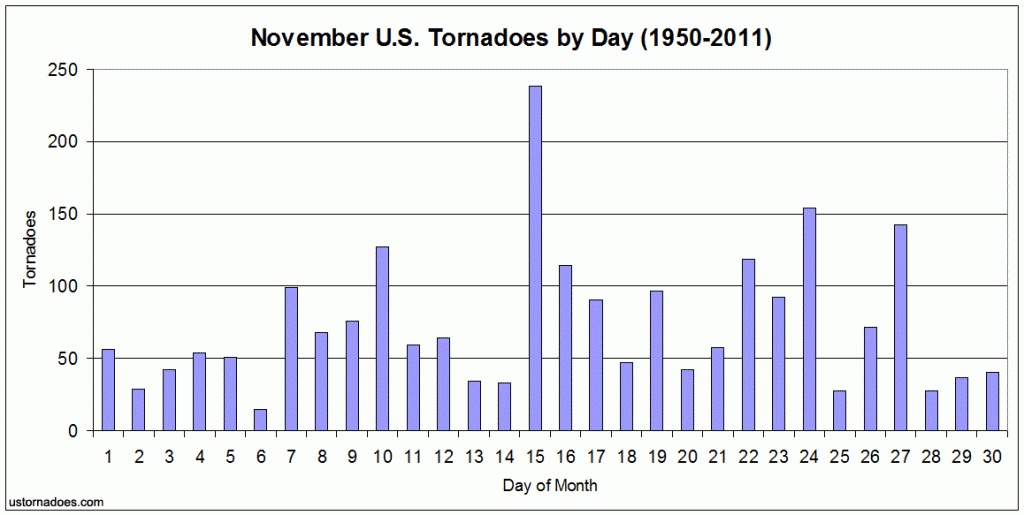
Looking at total tornadoes by day (which I will likely replace with tornado days stats in future edits of these posts), a considerable amount of variability is shown. Like the monthly average going down despite November having more tornadoes than October, the tornado days in November are down as well. The current climatological period (1991-2010) shows that just under 1/4 of all days in November can be expected to feature a tornado. This is higher than the winter months to come, but lower than every other month in the year.
Related: Average Number of Tornadoes in November by State
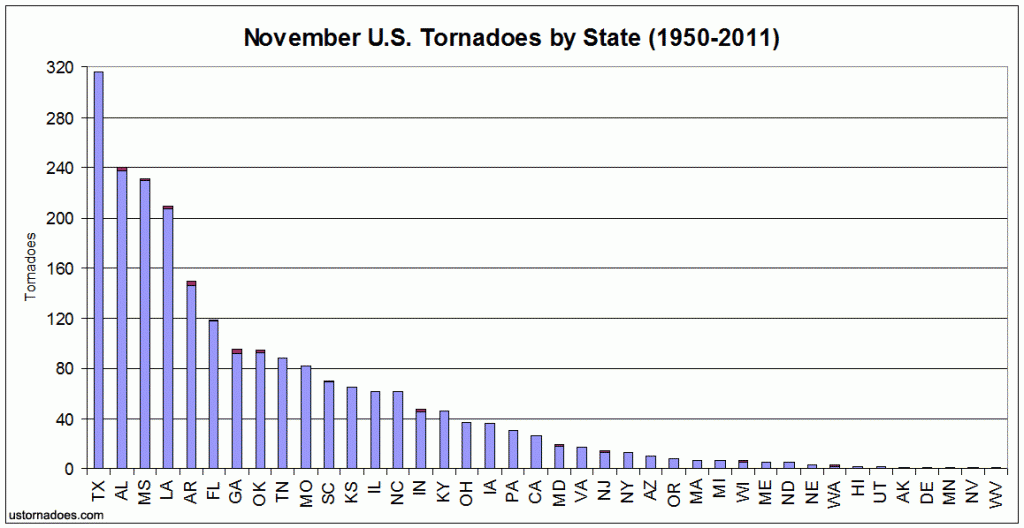
Texas, the size-leader, takes the prize for having the most tornadoes in November, as with most months. Yet, other than Texas, all the other top five states have seen increased tornado activity compared to the month prior. Alabama (#2) has recorded more than a two fold increase from month to month, as has Mississippi (#3) and Arkansas (#5). Louisiana’s (#4) increase is somewhat less sizable but still noticeable. A clear southern (and sometimes Midwestern) dominance to this uptick in tornado activity is noted, and it still tends to come in spurts.
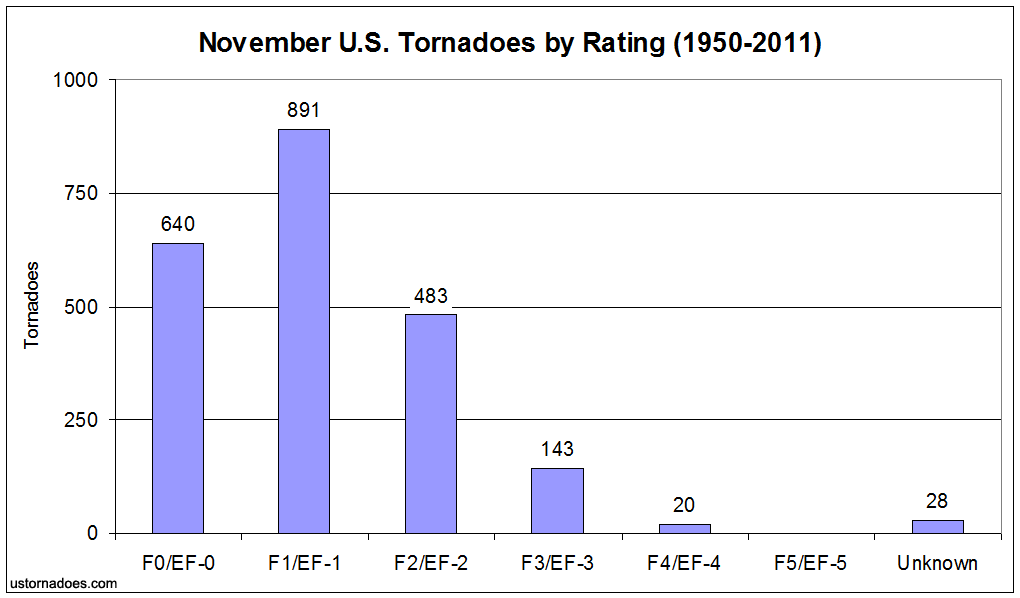
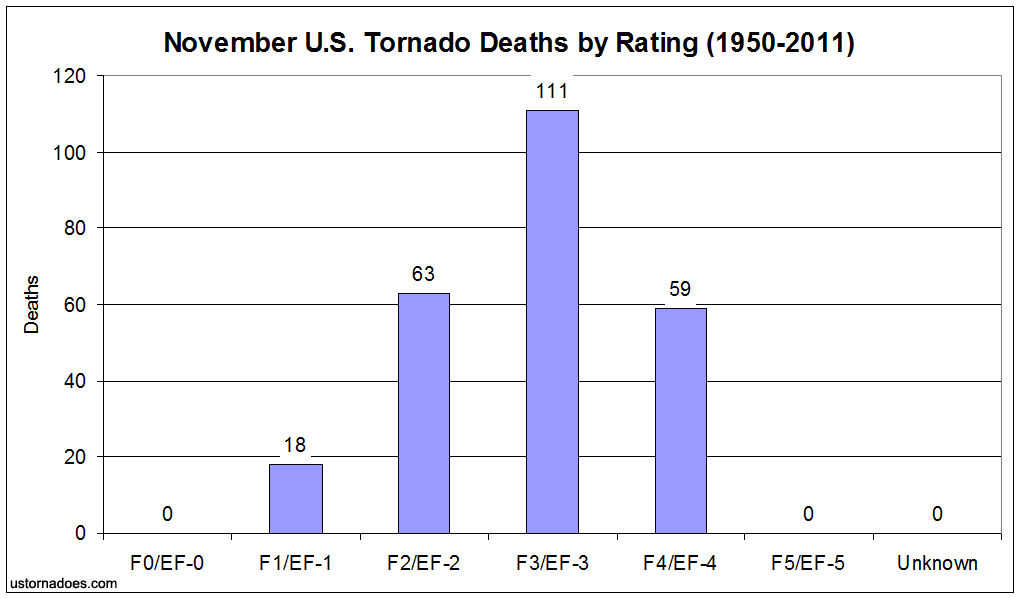
Significant tornadoes, or those rated F2/EF-2+, have accounted for 29.3% of November tornadoes during the 1950-2011 period and they have caused 93% of the deaths. The ratio of strong tornadoes to all tornadoes continues to rise from previous months. This is partly because of higher-population impact and the fact that events during the changing seasons tend to have more available energy to them than mid-summer storms, even if big outbreaks are rarer in the fall than spring.
The deadliest tornado in November occurred on the 6th in 2005 when an F3 traveled 41 miles from Kentucky into Indiana and through parts of Evansville, Newburgh and Boonville. 24 were killed by this tornado.
U.S. Tornado Climatology by Month
All: Jan | Feb | Mar | Apr | May | Jun | Jul | Aug | Sep | Oct | Nov | Dec
Significant: Jan | Feb | Mar | Apr| May | Jun | Jul | Aug | Sep | Oct | Nov | Dec
SPC tornado data obtained at the Tornado History Project. Images can be selected for larger versions. Data for the prior year gets released in early spring the following year. Get updates about U.S. Tornadoes on Twitter and Facebook.
Latest posts by Ian Livingston (see all)
- Busy March for twisters to end with another multi-day event - March 28, 2025
- Everything but locusts: NWS shines in apocalyptic weather - March 17, 2025
- Top tornado videos of 2023 - January 1, 2024
