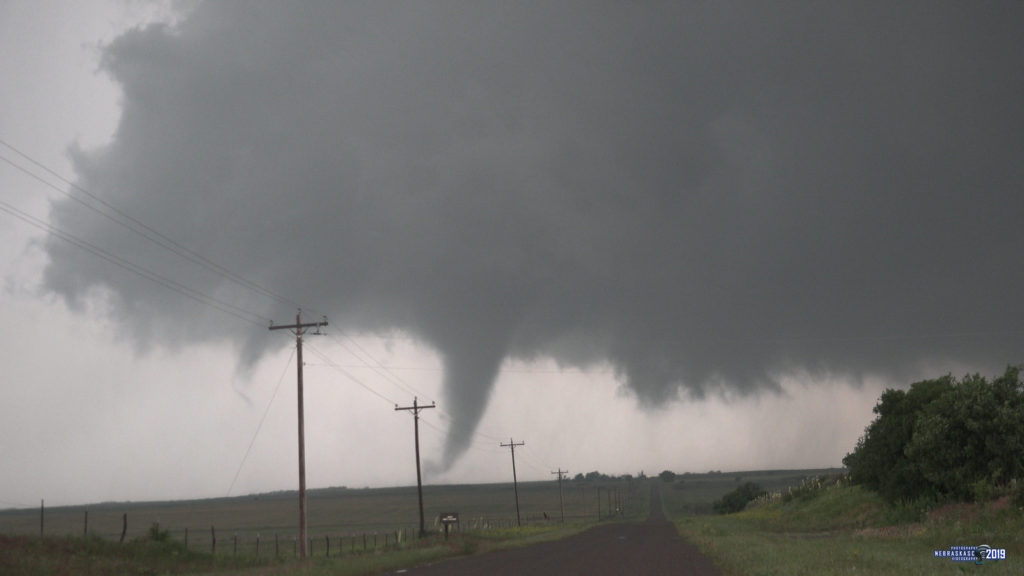
Peak tornado season is here. While it is true that tornadoes can happen across the calendar, the spring and early summer is highly favored over other time.
Out of the 71 years in the modern record (since 1950), the peak month for tornadoes has been April a surprisingly-small seven times, May 35 times, and June 25 times.
However, when one looks at strong tornadoes, or those which cause the most havoc and are rated F/EF2+, some different patterns show up. Here we see April the peak month in 25 of the 71 years, May in 23, then March and June with eight each.
You can examine the data in the table below.
| Year | F/EF0+ high mo | F/EF0+ high | F/EF2+ high mo | F/EF2+ high |
|---|---|---|---|---|
| 1950 | May | 61 | May | 21 |
| 1951 | Jun | 76 | Jun | 30 |
| 1952 | Mar | 43 | Mar | 34 |
| 1953 | Jun | 110 | May | 50 |
| 1954 | Apr | 113 | Apr | 50 |
| 1955 | Jun | 153 | Apr | 49 |
| 1956 | Jul | 92 | Apr | 49 |
| 1957 | May | 228 | Apr | 93 |
| 1958 | Jun | 128 | Jun | 42 |
| 1959 | May | 226 | May | 81 |
| 1960 | May | 201 | May | 77 |
| 1961 | May | 137 | Mar | 66 |
| 1962 | May | 200 | May | 73 |
| 1963 | Jun | 90 | Apr | 51 |
| 1964 | Apr | 157 | Apr | 63 |
| 1965 | May | 273 | May | 98 |
| 1966 | Jun | 126 | Jun | 32 |
| 1967 | Jun | 210 | Apr | 68 |
| 1968 | May | 142 | Apr | 49 |
| 1969 | May | 145 | Jun | 54 |
| 1970 | Jun | 134 | Apr | 63 |
| 1971 | Jun | 199 | May | 63 |
| 1972 | May | 140 | Apr | 44 |
| 1973 | May | 250 | May | 95 |
| 1974 | Apr | 267 | Apr | 157 |
| 1975 | Jun | 196 | May | 51 |
| 1976 | Mar | 180 | Mar | 85 |
| 1977 | May | 228 | May | 49 |
| 1978 | May | 213 | Apr | 38 |
| 1979 | Jun | 150 | Apr | 43 |
| 1980 | Jun | 217 | Apr | 50 |
| 1981 | Jun | 223 | May | 57 |
| 1982 | May | 329 | May | 65 |
| 1983 | May | 249 | May | 77 |
| 1984 | Jun | 242 | Jun | 44 |
| 1985 | May | 182 | May | 39 |
| 1986 | May | 173 | Mar | 29 |
| 1987 | Jul | 163 | Jul | 19 |
| 1988 | May | 132 | Nov | 37 |
| 1989 | Jun | 252 | May | 40 |
| 1990 | Jun | 329 | Jun | 62 |
| 1991 | May | 335 | Apr | 53 |
| 1992 | Jun | 399 | Jun | 61 |
| 1993 | Jun | 313 | Jun | 32 |
| 1994 | Jun | 234 | Apr | 25 |
| 1995 | May | 394 | May | 66 |
| 1996 | May | 235 | Apr | 37 |
| 1997 | May | 225 | Mar | 47 |
| 1998 | Jun | 376 | Apr | 38 |
| 1999 | May | 310 | Jan | 46 |
| 2000 | May | 241 | Apr | 23 |
| 2001 | Jun | 249 | Nov | 28 |
| 2002 | May | 204 | Nov | 30 |
| 2003 | May | 542 | May | 80 |
| 2004 | May | 509 | May | 39 |
| 2005 | Jun | 317 | Nov | 35 |
| 2006 | Apr | 244 | Mar | 33 |
| 2007 | May | 252 | Mar | 32 |
| 2008 | May | 460 | May | 77 |
| 2009 | Jun | 270 | Apr | 30 |
| 2010 | Jun | 321 | May | 44 |
| 2011 | Apr | 757 | Apr | 166 |
| 2012 | Apr | 204 | Mar | 38 |
| 2013 | May | 267 | Nov | 34 |
| 2014 | Jun | 286 | Apr | 35 |
| 2015 | May | 381 | May | 27 |
| 2016 | May | 217 | May | 31 |
| 2017 | May | 291 | Apr | 26 |
| 2018 | May | 170 | Apr | 15 |
| 2019 | May | 511 | May | 56 |
| 2020 | Apr | 251 | Apr | 54 |
Perhaps most interesting is that a number of years — five, to be exact — have a November peak for strong tornadoes.
2013 is an extreme instance of a November tornado outbreak, with all but a handful of its 34 strong tornadoes happening in one event. Other years like 2005 had both very low numbers in spring and summer plus a number of events in November. All of these Novembers did have at least one significant outbreak.
In the “Doppler era,” which I think of as 1995 onward, November is the peak month for strong tornadoes as frequently as March, with four instances each.
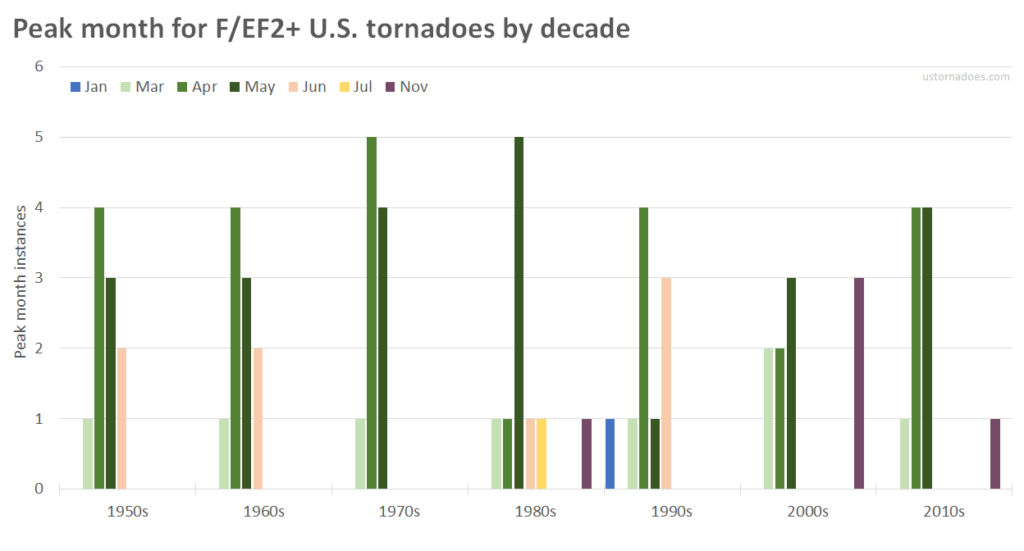
As with a lot of tornado stats, any longer-term trends seem mushy. If anything, it would seem there are perhaps a few stories to highlight:
- May is increasingly the peak of overall tornado season. Not totally surprising. Chasers and dual pol doppler see a lot of low-end stuff we used to miss. More of the country is in play. The jet stream has not yet retreated.
- June strong tornado peak is a thing of the past? In the last two decades, there have been no June peak years for strong tornadoes. This compares to an average of two per decade prior.
- Novembers to remember more common? This could be an artifact of increased sensitivity to catching more tornado events. Or it could be in concert with the fact that spring activity has been underwhelming in a number of years.
Below is a map showing which month is peak by state during the Doppler era (through 2019, when SPC data is available).
Since I’m using all tornadoes — including the weakest and loneliest — in the first map, I started with the Doppler era to isolate the period with the least overall number inflation (thanks to better observation) compared to prior years.
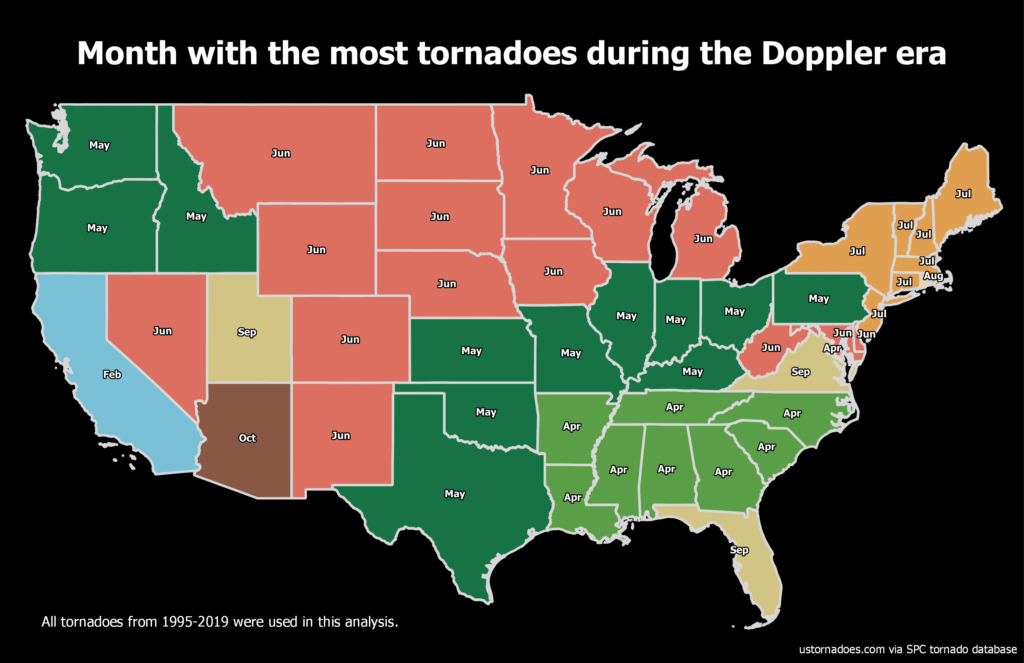
The map nicely highlights when various states historically see their greatest tornado risk.
In April’s case it is the South into the Southeast most often under the gun. By May, the zone of activity tends to favor the southern and central Plains into the flatlands of Illinois and Indiana, then off to the Ohio Valley region.
From there, the northern tier and high Plains as well as the mid-Atlantic tend to see the most tornadoes in June, with the northeast usually favoring July.
Although weighted by a few years in the case of Virginia, it’s worth pointing out that a few states have a September peak for tornadoes. This is largely associated with landfalling tropical cyclones, particularly in Florida.
When it comes to strong tornadoes, or those causing the majority of deaths and damages, the map looks relatively similar.
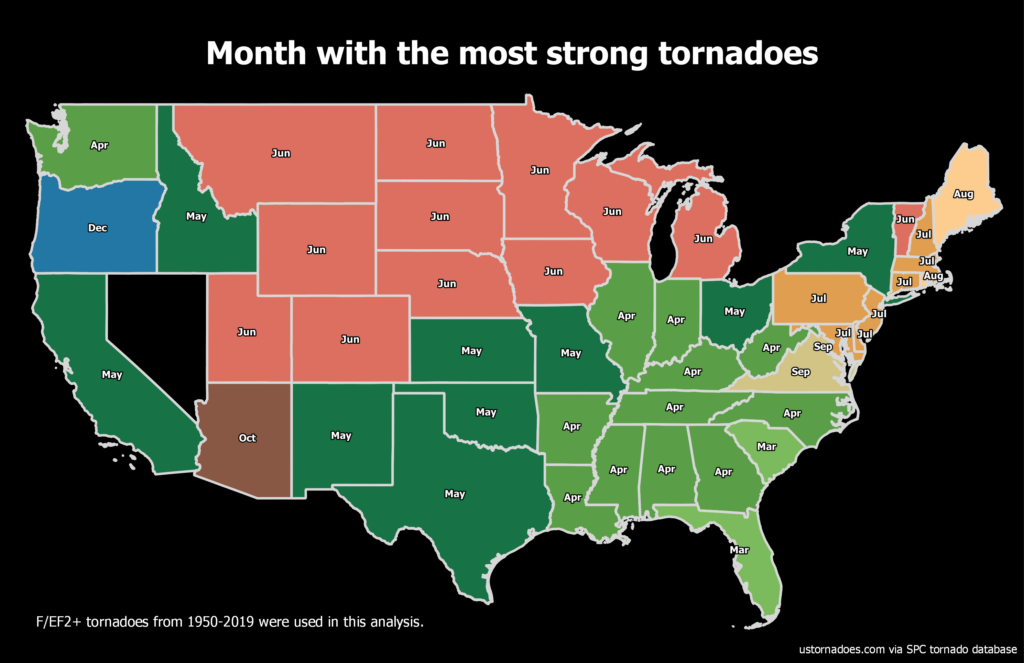
In most of the big tornado states — places like Alabama, Mississippi, Texas, Oklahoma, Kansas — the peak for strong tornadoes is unsurprisingly about the same for the peak of tornadoes overall. There is also a peppering of March in the Southeast and a few changes elsewhere.
Finally, let’s look at how many tornadoes the typical peak month witnesses.
April 2011 delivered an astounding 757 tornadoes, bolstered by the Super Outbreak focused on the 27th. Behind that, the top five months are all May. As recently as May 2019, the United States saw an incredible 511 tornadoes as outbreak after outbreak occurred mid- and late month.
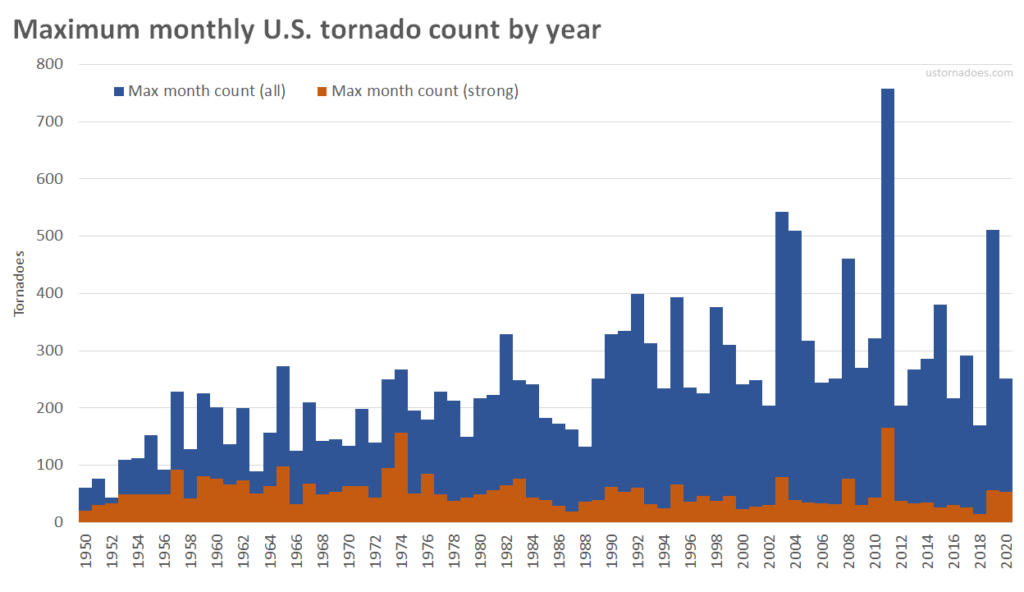
The current 25-year running average is about 335 tornadoes in the busiest month of a year and it has been relatively steady for about a decade. Keep in mind there is inflation over time due to increasing spotter activity and detection technology.
The “strong” tornado category does not see that inflation as much. The current average for strong tornadoes in a peak month is in the mid-40s, near where it has hovered since the advent of Doppler.
1974 and 2011 are in a league of their own with 157 and 166 F/EF2+ tornadoes respectively. In 2019 there were “only” 56 EF2+ confirmed during the May volley. 2020 had 54 strong tornadoes despite featuring less than half the tornadoes of 2019 in the peak month.
Even with some expectations in mind, individual tornado outbreaks can make or break a peak month, and it seems likely that some longer-term shifts are ongoing thanks to climate change.
Top photo via NebraskaSC, May 20, 2019, in Mangum Oklahoma.
Latest posts by Ian Livingston (see all)
- Busy March for twisters to end with another multi-day event - March 28, 2025
- Everything but locusts: NWS shines in apocalyptic weather - March 17, 2025
- Top tornado videos of 2023 - January 1, 2024
You give us charts but don’t explain the colors. So how do we interpret the graphs?
I’m not affiliated with the writer of the article, but I think the colors are arbitrary (and probably unnecessary), where in the chart states with the same peak months are grouped by the same color.