A look at tornadoes by rating (maps)


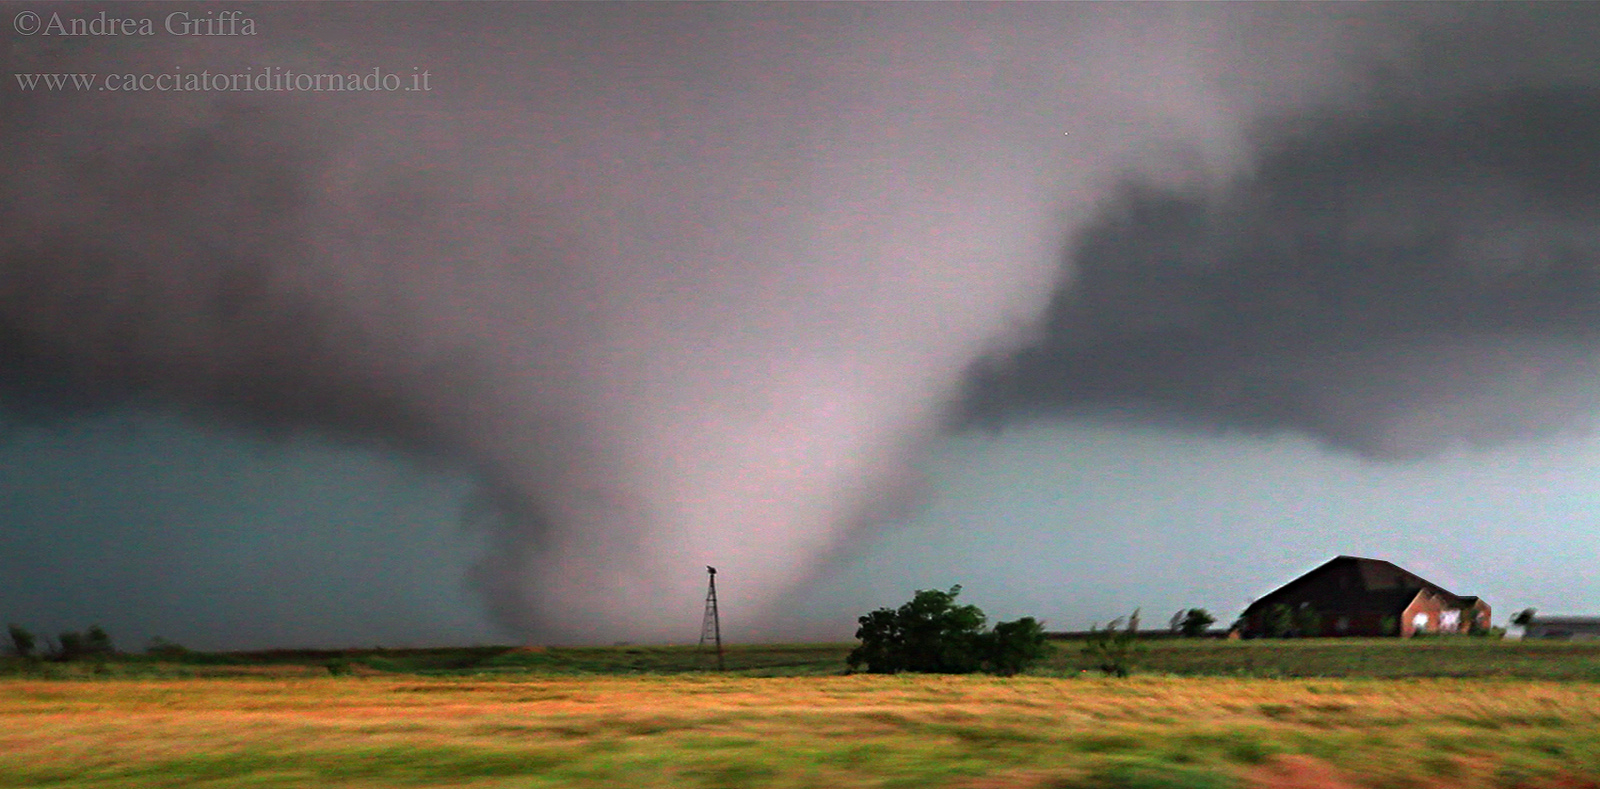
The beginning of the widest-on-record El Reno tornado of May 31, 2013. (Andrea Griffa via Flickr)


The modern tornado record began in 1950. It tells many stories. While seasonal tornado information is highly incomplete across the early part of the period, we are now approaching 70 years worth of detailed information.
There are over 60,000 tornadoes cataloged in the database. The country averages somewhere in the neighborhood of 1,200 twisters each year, although tornado tallies typically vary considerably from season-to-season.
Scientists and other observers have learned quite a lot about tornadoes and the locations they tend to favor over this time. When it comes to the weakest and shortest lived of events, pretty much the whole country is at some risk. As tornado intensity grows, the area that has been touched thankfully dwindles.


About 90 percent of tornadoes in the record are weak. These are tornadoes which are rated EF0 or EF1 (on the Enhanced Fujita Scale) since February 2007, and F0-F1 (on the Fujita Scale) prior to that*.
Link: The Enhanced Fujita Scale (current scale) | The Fujita Scale (original, replaced)
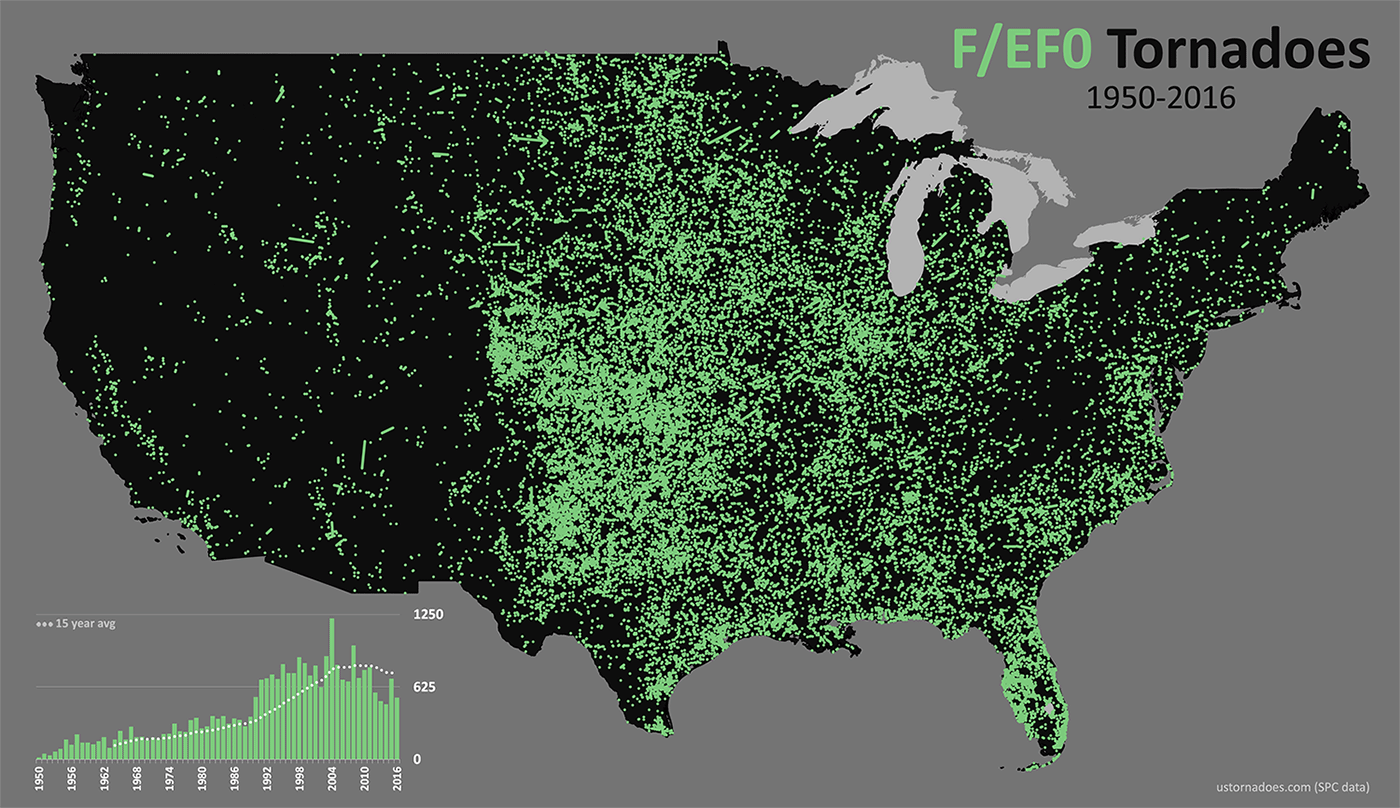
In the 15 years ending 2016, the vast majority of all weak tornadoes are rated F/EF0. With winds of 65 to 85 on the enhanced scale, these tornadoes are possible in most of the country. Notable hot spots include the Plains into Midwest, as well as parts of the South and Florida. F/EF0s have seen an obvious rise in numbers over time, although much of this can be attributed to better sensing and spotting abilities. The current 15-year average is 729 EF0 tornadoes per year.
Although still very numerous across the record, average annual numbers per year drop by about half comparing F/EF1 tornadoes with their weaker siblings. An average year might have about 356 such twisters, or a little less than half the F/EF0 number. Featuring winds of 86 to 110 mph on the current scale, these tornadoes have struck much of the country at one point or another.
Regions where F/EF1 tornadoes are extra-frequent include states in the south and central Plains, as well as portions of the Mid-South and stretching into Florida.
Once to the F/EF2 level, we start talking about significant tornadoes. They’re also known as strong tornadoes. This is about when the winds become extremely problematic for those in the path. (note: make no mistake that a weak tornado hitting you is a big problem as well.) Events of F/EF2 strength or greater make up around 10 percent of the record, but they account for over 95 percent of the deaths.
Places that see a lot of F/EF2 tornadoes include Texas and the southern Plains into Kansas, as well as parts of the Midwest and Dixie. While the trend-line appears to have gone down over time with these types of tornadoes, there is some question to how much is a real trend and how much is changing rating methodology. About 98 F/EF2s might be expected in any year at present.
As tornadoes reach the F/EF3 level of damage, wind speeds of 136 to 165 mph batter everything in the way. Informally known as intense tornadoes, we start getting into rarefied air at this level. In any given year a few dozen may travel the lands. They are most common in places like the southern Plains and Dixie, but have been seen in locations like Utah and in each state across the West Coast.
Like strong tornadoes, slightly lower averages for F/EF3 tornadoes in recent years – 28 per year ending 2016 – may be more attributable to methodology changes than anything else.
F/EF4 tornadoes – featuring winds in the 166 to 200 mph range – leave total destruction in their wake. Fortunately, an average year only features a half-dozen of these twisters, because the damage they produce is hard to fathom. Locations at most risk for F/EF4s include the southern to central Plains, the Midwest and Dixie as well as surrounding parts of the Mid-South. The line way to the west? Wyoming. That twister happened at high elevation and it is known as the Teton-Yellowstone tornado.
Trends in F/EF4s appear more or less stable, although it has generally been driven by larger events over time, so one major outbreak can skew a year or grouping of years.
The rarest of the rare, F/EF5 tornadoes leave little in their wake. Capable of wiping a home totally off its foundation, and leaving only a slab of concrete behind, F/EF5 winds come with a more destructive force than can be easily imagined. Their winds reach astounding speeds of greater than 200 mph. The worst of the worst have been known to scour roadways off the surface of the land, and even those seeking shelter underground cannot always be guaranteed safety.
It’s unusual we see many years back-to-back with these kinds of tornadoes, with the longest stretch of years being four, from 1955-58 (7 F5s) and 1996-99 (5 F5s). The last one occurred in 2013 in Moore, Oklahoma.
As shown in the maps above, most of the country can end up at risk for a tornado under the right conditions. While they can happen in mountains, the conditions needed for them to form are much less likely there, or over the desert regions west of the Continental Divide, and in areas dominated by maritime air.
Large tornado maps: No states | states
Tornadoes do tend to congregate in thunderstorm areas, although some form under conditions that do not produce lightning and booming noises from above. The baddest most frequently focus their fury on the South, the Midwest, and the Plains states. Various “tornado alleys” are present in these regions, including the well-known one that stretches over a thousand miles north/south across the Great Plains.
While tornado numbers were up considerably across the beginning of the historical record, there has been something of a stabilization following the advent of Doppler radar and storm chasing becoming something of an American pastime. Additional sensing capabilities are still being added today, Although we now see most events, it is a certainty that we are still not seeing all tornadoes that occur.
…Notes…
*This also includes 30 unrated tornadoes among the 2016 events. These tornadoes have been included in the EF0 bucket for this post.
All data via Storm Prediction Center files.
Latest posts by Ian Livingston (see all)
- Tornado outbreaks: April, May and June peak-season primer - April 27, 2025
- Busy March for twisters to end with another multi-day event - March 28, 2025
- Everything but locusts: NWS shines in apocalyptic weather - March 17, 2025
Recent Posts
Tornado outbreaks: April, May and June peak-season primer
It's peak tornado season. We briefly examine the top outbreaks from April-June.
Busy March for twisters to end with another multi-day event
A dip in the jet stream is blasting toward the central United States and poised…
Everything but locusts: NWS shines in apocalyptic weather
A historic storm system swept through the central, southern and eastern U.S. from Friday through…
Girls Who Chase: Empowering Female Storm Chasers
In a field historically dominated by men, Jen Walton has emerged as a transformative figure…
The Storm Doctor: Dr. Jason Persoff
Jason Persoff, MD, SFHM, is recognized globally for his expertise in storm chasing. He earned…
Top tornado videos of 2023
Tornado numbers were near or above average. A chase season peak in June provided numerous…
View Comments
When I was age seven or so (around 1970), I recall reading in a book--perhaps it was in one of those Golden Nature Guides--that tornadoes often had a wind speed exceeding 500 miles per hour. I later saw a graphic in one of those "1001 Questions Answered" series books, which compared the winds of a low-pressure system, a hurricane and a tornado. The low-pressure system was depicted with a car traveling down a highway; the hurricane was depicted with a stock car at a race (such as the Daytona 500) and the tornado was depicted with a jetliner in flight.
Suffice it to say, we've learned much about tornadoes-and weather since then!
Thanks for the note. We have come a long way, but still far to go!
It is 'lazy' science to only consider tornado data since 1950. Reasonably accurate data on tornadoes and tornado damage, including photos, extends back to 1900. See Tom Grazulis' Significant Tornadoes book, often referred to as The Green Book.
That is a great resource, it was the basis of an early idea for the site that never really took hold. https://www.ustornadoes.com/2012/02/22/onthisday-selected-february-tornadoes/
I have seen some of the data digitized but not in a particularly usable format. If lazy science is using the official database and playing around with it in free time.. then guilty as charged!
Is there any chance you have spare time to update the dataset?