What the top tornado days of each year since 1950 tell us

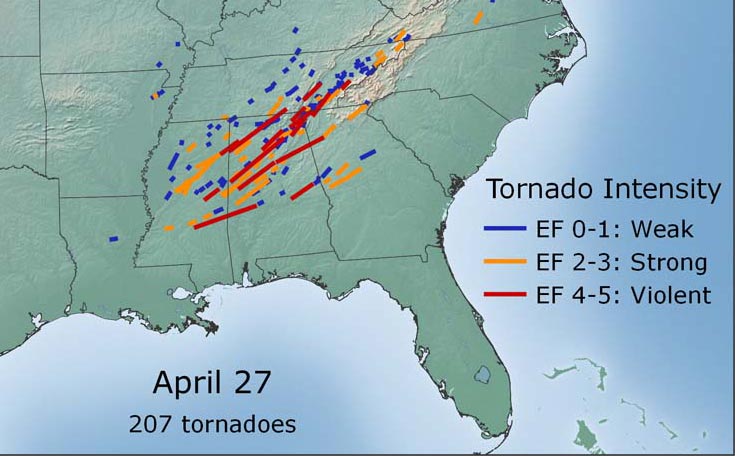

In recent history, the top calendar day count for tornadoes has averaged a handful more than five dozen twisters.
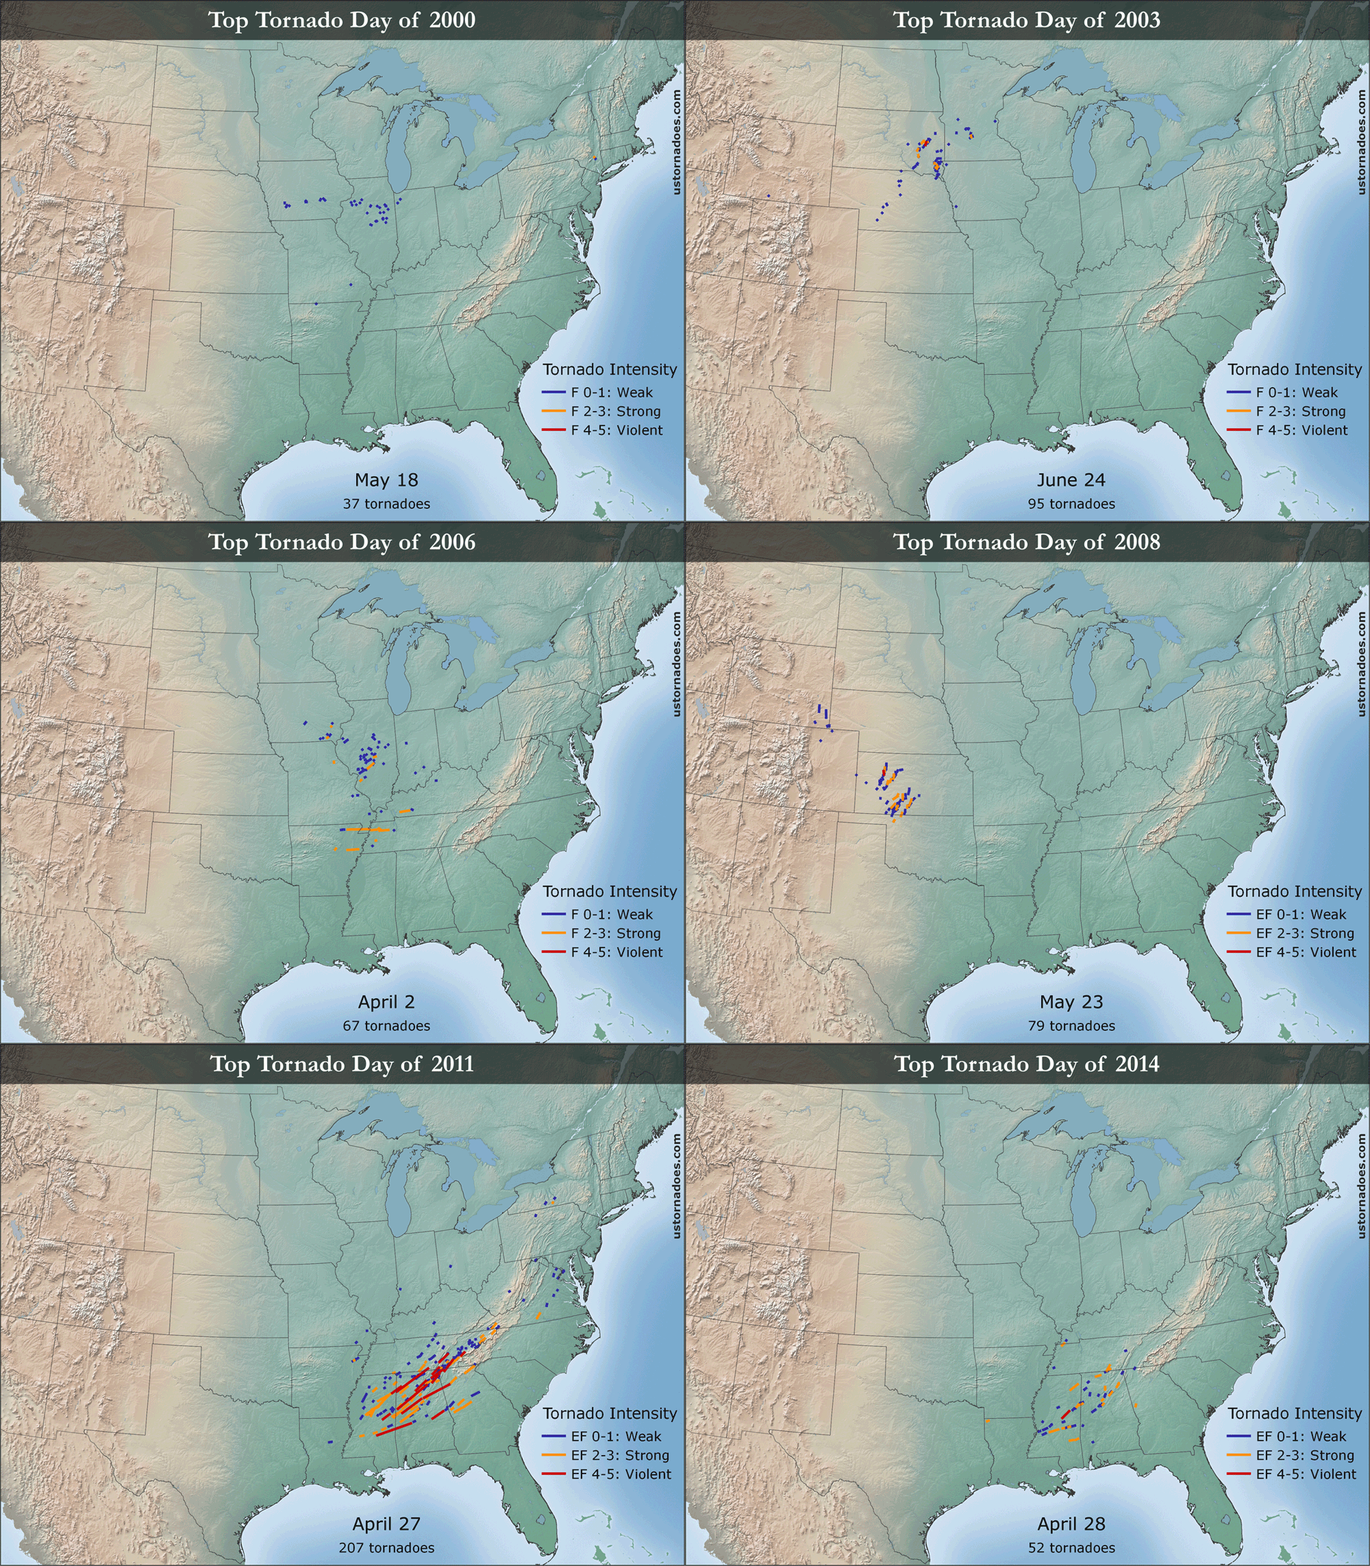
Of course, that’s skewed by a wild year such as 2011. It featured a top tornado day in April 27 which dropped an astounding 207 tornadoes.
Even with that year removed, the average for a top tornado day is about 60 tornadoes. An intense and unforgettable day for anyone involved.
Editorial note: The apparent increase in overall tornado numbers throughout time is heavily a function of more eyes on storms and a large increase in the lowest ranking numbers in recent decades because of such. Full counts of tornadoes were used to portray a more accurate picture of events of the day, rather than isolating stronger ones in attempt to gauge any “trend.”
Above is an animation of the top tornado days since 2000. If seeking maps prior to 2000 immediately… scroll away to the end!
There are some quick standouts in there, not just limited to the main day of the super outbreak in 2011. June 24, 2003; May 5, 2007; June 17, 2010 — all big events impacting fairly large areas.
Thanks to increased storm chasing and spotting, as well as further advances in Doppler technology, all but one of the top tornado days on record are relatively recent. But if you scroll to the end and look through all the maps going back to 1950, you’ll find some biggies in the past as well. Just to highlight a few: April 3, 1974; September 20, 1967; April 2, 1982.
So, when does the biggest tornado day of the year usually occur?
Throughout the entire modern record going back to 1950, the top tornado day of the year has fallen in May 35 percent of the time. That compares to 23 percent in April and 18 percent in June. The “second season” — which tends to focus on November — is also apparent, with a notable six top annual tornado days in 65 years.
April 4 has been the top tornado day three times since 1950, and so has May 5. Below that highest level, four days in May have been top tornado days twice and the same for June. Those max tornado days are spaced throughout the range of the two months, one being April 2 and another May 31. By the mid-point of May, a little less than half of the record saw its biggest tornado day of the year.
The heart of summer into early fall is very much biggest-tornado-day free. The only July-October occurrence came with Major Hurricane Beulah in September 1967. That event dropped over 100 tornadoes in total and was the record holder for tropical systems until Hurricane Ivan took its spot in 2004.
If anything, over the last 30 years of the record, the most tornadic day of the year has perhaps shifted a little earlier in the season and become more common late in the year. 33 percent fell in May, 27 percent in April and 17 percent in June during that shorter period. November also has five of its six total top tornado days in the most recent 30 years, and accounts for as many as June in the smaller sample.
How many tornadoes does the top tornado day tend to drop?
The “average” for tornado numbers on the biggest tornado day of the year is presently over five dozen. The number comes out to 67 using the last 30 years ending 2014, or 62 if you remove 2011 and replace it with 1984.
As in the note above, a reminder: much of the increase in top tornado day numbers is the lower end of the scale. Simply put, a lot more tornadoes are actually seen today than in the past. It’s likely we’ve reached near-full awareness, though there may still be some twisters hiding behind a hill or in a batch of trees that no one thinks to check after the fact.
Since 1990ish, the trend line has stayed above 50 tornadoes on the top tornado day way more often than not. Prior, the bar was a little lower, and many tornadoes were not documented in your typical year.
Over the course of the 30 years ending 2014, 1987’s top tornado day only had 28 tornadoes, a low for the period. April 27, 2011’s 207 calendar day tornadoes hold the record for that time frame, and all-time in the modern record.
Notably, despite 2012-2014 all finishing on the lower end of the annual scale, each had fairly sizable top tornado days. That said, 2014’s top tornado day was the least productive since 2000.
Are there regions in which a top tornado day is likely to target?
The answer here is, “almost certainly.” As with other tornado metrics, it’s hard to fully quantify. In the graph above, I’ve pulled out the top two states for tornado touchdowns from each of the top annual tornado days and mashed them all together.
Kansas is the undisputed winner in both number one spots and also combined first and second place finishes. States that are frequently heavily involved in a top tornado day, but tend to fall in second place for the daily touchdown count, include Illinois, Oklahoma and Iowa.
Some states, or the lack thereof, might be surprising as well.
Even getting the Southeast heavily involved in a top tornado day has been difficult despite the frequent occurrence of tornadoes. You’ll notice Florida — number three among the states for annual tornado averages — is entirely missing from the main body of any top tornado days. On the flip side, Pennsylvania is home to the most touchdowns on two top tornado days (1985 & 1998). Even New York and parts of New England have gotten in on the action.
What other characteristics do top tornado days tend to have?
This section might be somewhat intuitive, but worth a review nonetheless.
A day with a huge number of tornadoes is likely to produce at least one strong tornado (F/EF2+). Only two years in the modern day record through 2014 had a top tornado day without a strong (at least verified) one in the mix. They were both rather recent too. 1988 and 2000.
Stepping up to the real bad boys of the twister world, we find that a solid majority of top tornado days over the modern record have had at least one violent twister (F/EF4+). When it comes to one violent tornado, 60 percent of annual top tornado days have had them. Two violent or more? 35 percent.
Long-track tornadoes are frequenters of the big tornado day as well. 75 percent of those days have had at least one long-track tornado. As we’ve examined in the past, long-track tornadoes tend to be somewhat strong (perhaps because they have a better shot of realizing their potential), and many of the long-trackers in this sample are.
All the maps
Below, I’ve included each year individually back to 1950. It’s probable that the record isn’t “stable” — as far as eyes and radar coverage — until sometime in the relatively recent past.
All tornado data in this post was obtained via the Storm Prediction Center’s file covering 1950-2014.
Latest posts by Ian Livingston (see all)
- Tornado outbreaks: April, May and June peak-season primer - April 27, 2025
- Busy March for twisters to end with another multi-day event - March 28, 2025
- Everything but locusts: NWS shines in apocalyptic weather - March 17, 2025
Recent Posts
Tornado outbreaks: April, May and June peak-season primer
It's peak tornado season. We briefly examine the top outbreaks from April-June.
Busy March for twisters to end with another multi-day event
A dip in the jet stream is blasting toward the central United States and poised…
Everything but locusts: NWS shines in apocalyptic weather
A historic storm system swept through the central, southern and eastern U.S. from Friday through…
Girls Who Chase: Empowering Female Storm Chasers
In a field historically dominated by men, Jen Walton has emerged as a transformative figure…
The Storm Doctor: Dr. Jason Persoff
Jason Persoff, MD, SFHM, is recognized globally for his expertise in storm chasing. He earned…
Top tornado videos of 2023
Tornado numbers were near or above average. A chase season peak in June provided numerous…
