Last week, we took a first crack at total (F0/EF0+) tornado days in the U.S. during the current 1991-2010 averaging period. There was an impressive number of days which had tornadoes in all twenty years.
While all tornadoes are potentially dangerous, those that attain significant (or F2/EF-2+) status are the ones we really begin to worry about when it comes to life and property. Fortunately, these tornadoes are considerably less frequent than their smaller siblings, but what they lack in numbers they make up in ferocity. Over the entire modern record, through 2010, they caused 95% of tornado fatalities.
I’ve expanded this first look at significant tornado days to a 30-year set rather than the 20 used in general tornado days. The total data points at 20 years were somewhat small to be visually useful, and even at 30 years they leave a little to be desired. Still, enough of a picture forms for them to begin to tell the significant tornado climatology story, and the deeper we get into the record the more question arises to actual strength (for instance, recent post-analysis indicates many F2s in the 1950s may have actually been weaker even while tornadoes as a whole were likely under-reported).
This interesting paper, by B. D. Malamud and D. L. Turcotte, also uses the same time period with a slightly different metric (tornado tracks over 10 km).
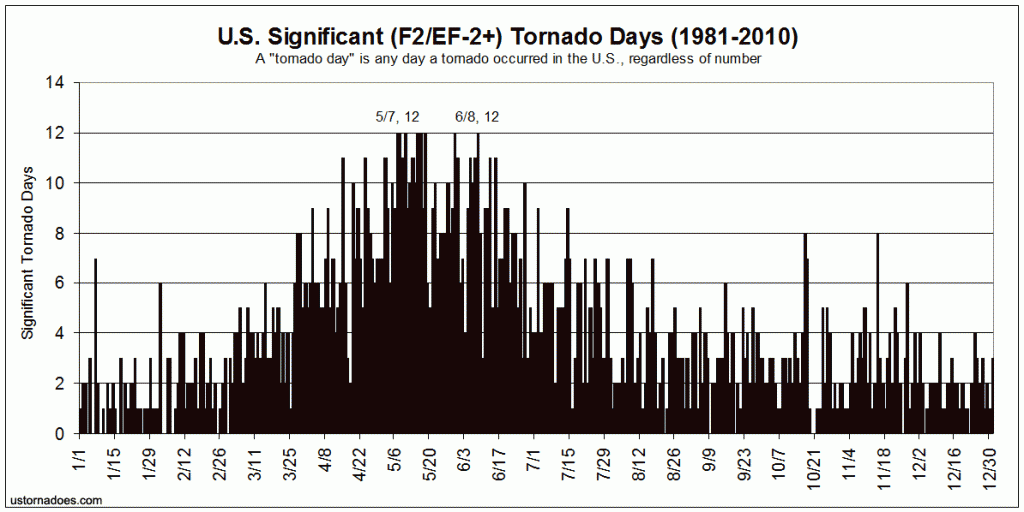
Whereas a count of tornado days including all tornadoes peaked in June during the previous analysis, significant tornadoes tend to favor May more heavily. The highest daily count for significant tornadoes over the 30-year period is 12. This raw peak occurs from May 7 through June 8, with seven of the eight highest occurrences happening in May.
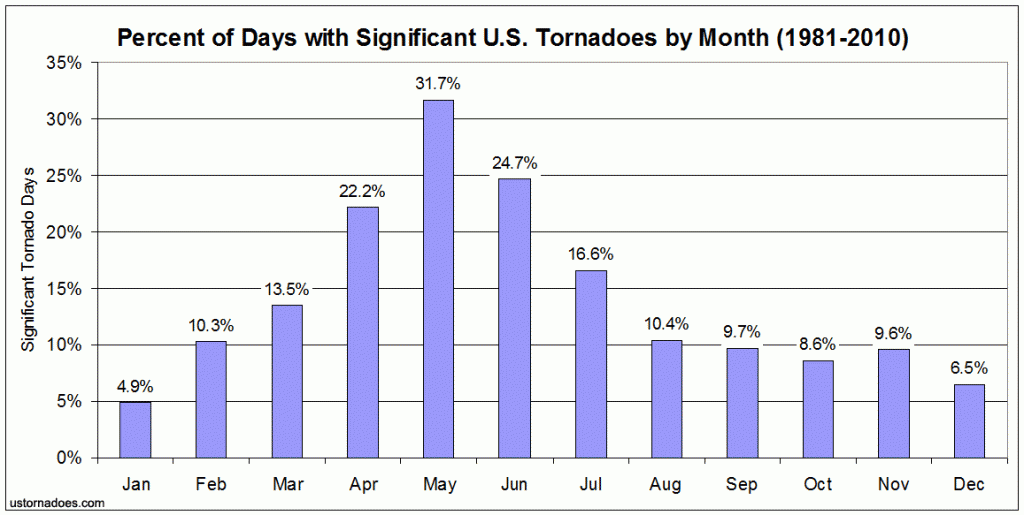
When looking at the whole period by month, we find that 31.7 percent of days in May had a tornado with a rating of F2/EF-2 or higher. June comes in second with nearly 25 percent of days and April in third with just over 22 percent of days. The raw histogram here more closely matches the overall tornadoes by month number compared to the tornado days by month number, with a quick rise from March to May and quick fall afterwards into a more stagnant number from mid-to-late summer through fall.
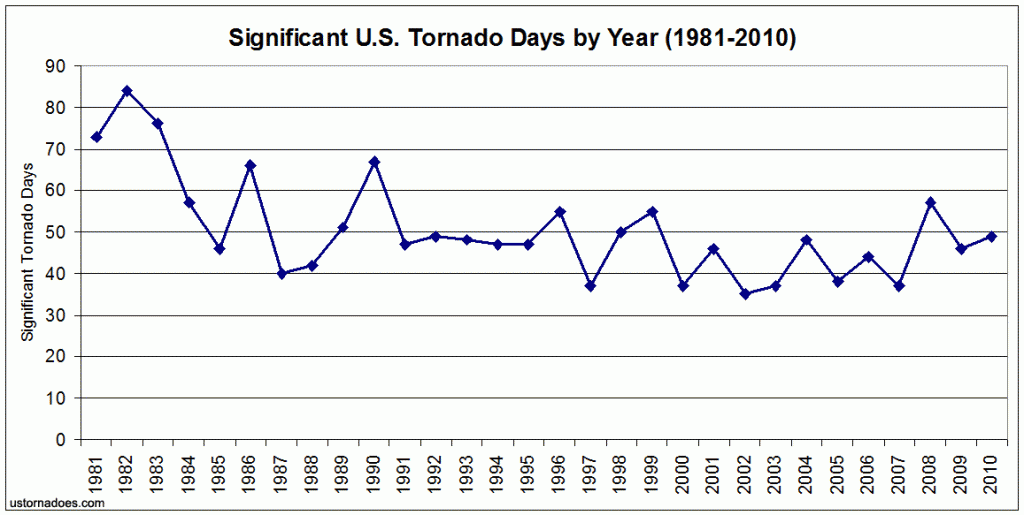
One seemingly interesting note in this set of data is the idea that significant tornado days by year — while fairly consistent — have tended to fall over the period, as an average at least. If we were to overlay a simple linear trend-line based off the graph of significant tornado days per year it would show tornado days dropping from near 60 at the start of the period to around 40 at the end of it.
As a raw count, the 2001-2010 period saw 437 significant tornado days. 1991-2000 witnessed 471 and 1981-1990 saw a notably higher total of 602, bolstered by several big years early in that 10-year time-slot.
In future analysis we’ll look at the whole period — the 70s into the early 80s are known as tornado years thanks in part to stronger wind shear over the U.S. at the time. Then there’s 2011. Raw tornado data has very recently been released by the SPC for last year, and will also be examined further in the future.
Graphs can be viewed larger by selecting. SPC tornado data obtained through the Tornado History Project. Get updates on U.S. Tornadoes on Twitter and Facebook.
Latest posts by Ian Livingston (see all)
- Busy March for twisters to end with another multi-day event - March 28, 2025
- Everything but locusts: NWS shines in apocalyptic weather - March 17, 2025
- Top tornado videos of 2023 - January 1, 2024
