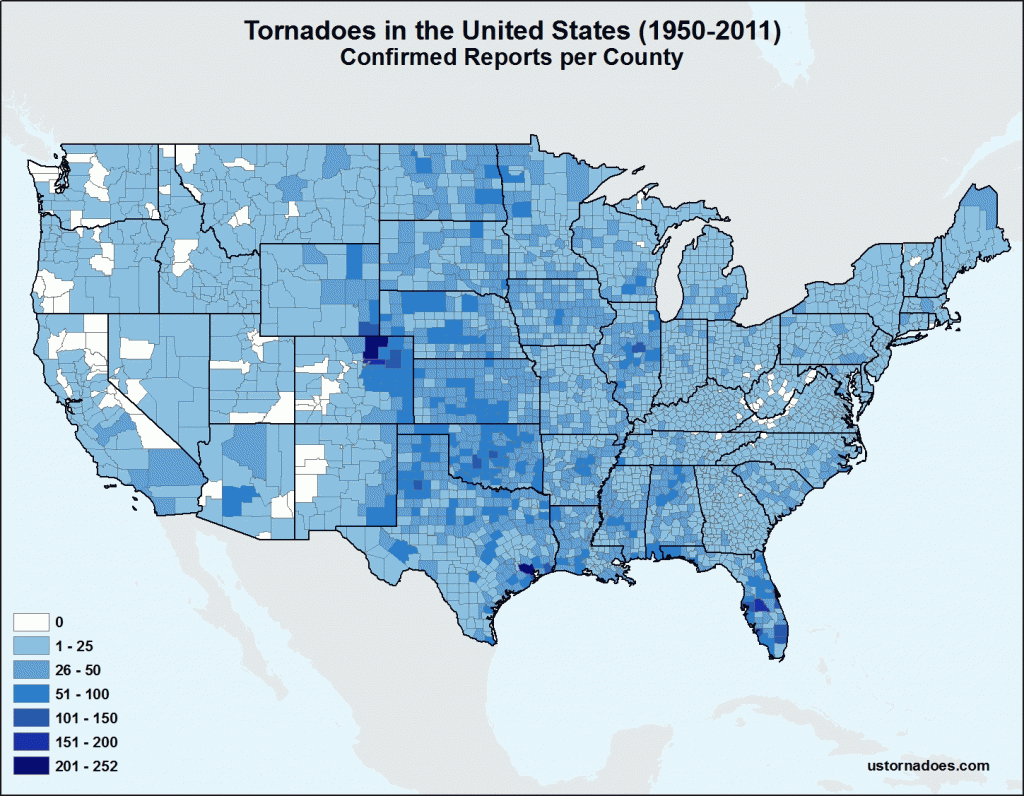
The map above shows county-level impacts of all U.S. tornadoes from 1950-2011. In this analysis, if one tornado crosses multiple counties, we have included it as an individual tornado for each county hit.
As would be expected by the name, Tornado Alley has had relatively consistent activity throughout the region from North Dakota to Texas. In addition to much of the Plains being highlighted in darker blues, additional areas from Louisiana through Alabama have had enhanced tornado activity as have parts of the Midwest and Ohio Valleys. Florida also ranks up there, though compared to other places further west, much of Florida’s tornado activity is rather weak.
Weld County, Colorado leads the way with a total of 252 tornadoes for the entire period. Harris County, Texas also breaks the 200 barrier with 213 tornadoes. A sampling of other counties that have high tornado counts include: Polk County, Florida with 158; Adams County, Colorado with 156; Palm Beach County, Florida with 150; Hillsborough County, Florida with 138; and Washington County, Colorado with 134.
Though not shown on the map, Alaska has had four tornadoes touchdown in the state during the period. Hawaii has had 40 tornadoes touchdown, with Honolulu and Hawaii Counties recording 17 and 10 tornadoes respectively.
View interactive map » (pops up in sized window — works best in Firefox)
Katie Wheatley
Latest posts by Katie Wheatley (see all)
- March 29-31, 2022 tornado outbreak - April 3, 2022
- March 25, 2021 tornado outbreak - March 25, 2021
- May 3-4, 1999 tornado outbreak and the Bridge Creek-Moore F5 - May 3, 2019


Very Cool map! It would be interesting to see the density of tornadoes in the US by normalizing the number of storms by the acreage of each county.
Awesome work! I shared this link on my Facebook and Twitter accounts. Agreed with the poster above it would be great to see the data normalized as well to account for the size of each county.
Ryan